35,000+ smart investors are already getting financial news, market signals, and macro shifts in the economy that could impact their money next with our FREE weekly newsletter. Get ahead of what the crowd finds out too late. Click Here to Subscribe for FREE.
A grocery receipt can look like little more than a long strip of product names and numbers, but it quietly records much more: changing food prices, smaller packages, convenience spending, taxes, promotions, store choices and shifts in what a household considers essential. In Canada, those details matter because grocery prices have continued to move differently from overall inflation, while individual categories have followed very different paths.
These 20 clues hidden in Canadian grocery receipts show why the total at the bottom can rise even when shopping habits seem unchanged. Some reveal straightforward price increases. Others expose changes in package sizes, product mix, taxes, loyalty discounts and purchasing strategies that are easy to miss when attention stays fixed on the final total.
Grocery Inflation Can Outrun the Rest of the Receipt
20 Ways Canadian Grocery Receipts Reveal Where Money Is Going
- Grocery Inflation Can Outrun the Rest of the Receipt
- The Tax Line Shows That Not Everything in the Cart Is Treated as a Staple
- Meat Can Consume a Disproportionate Share of the Weekly Budget
- The Price per Kilogram Tells More Than the Sticker Price
- Coffee Can Turn a Routine Purchase Into a Noticeable Expense
- Smaller Packages Can Make the Same Price More Expensive
- Produce Prices Can Swing Much Faster Than the Overall Grocery Bill
- The Produce Total Depends Heavily on Which Fruits and Vegetables Fill the Cart
- Milk, Butter and Eggs Create a Large Staple Base Before the Extras Begin
- Bread and Rice Show How Purchase Frequency Changes the Monthly Picture
- Packaging and Supply-Chain Costs Are Hidden Behind the Shelf Price
- Prepared Food Can Cost More Than Ingredients—and Change the Tax Treatment
- The Store Name at the Top of the Receipt Can Be Part of the Savings Strategy
- Substitutions Can Hide How Much Prices Have Changed
- Promotions and Loyalty Discounts Can Separate Shelf Price From Actual Price
- Multi-Buy Deals Can Make “Savings” Harder to Judge
- Shampoo, Detergent and Paper Goods Can Inflate What Feels Like a Food Bill
- Category Totals Reveal Which Foods Absorb the Biggest Annual Share
- The Same Receipt Would Not Cost the Same Everywhere in Canada
- A Stack of Receipts Can Become a Personal Inflation Tracker
- 16 Costco Canada Habits That Could Be Costing Shoppers More Than They Save

The first clue is the simplest: groceries do not necessarily move in step with the overall cost of living. Statistics Canada reported that prices for food purchased from stores were 3.9% higher in June 2026 than a year earlier. The overall Consumer Price Index rose 2.8% over the same period. That difference helps explain why a household can hear that inflation has moderated while still feeling considerable pressure every time groceries are scanned.
The receipt makes that gap tangible. A family might buy roughly the same milk, meat, produce and pantry basics every week, yet watch the total edge upward faster than many other routine expenses. The important detail is not merely whether the bill increased but which categories contributed most. Comparing several months of receipts can expose clusters of increases that a single trip cannot. Grocery inflation is an average, but the register converts that average into a highly personal combination of products, quantities and substitutions.
The Tax Line Shows That Not Everything in the Cart Is Treated as a Staple

A surprisingly small tax total does not mean a grocery trip was inexpensive. Under Canada’s GST/HST rules, most basic groceries are zero-rated, meaning GST/HST applies at a rate of 0%. Fresh meat, vegetables and many other ordinary food staples can therefore account for a large share of spending without creating a corresponding federal sales-tax charge. Certain other foods and beverages, however, remain taxable.
That makes the tax portion of a receipt a rough clue to the basket’s composition. Carbonated beverages, candies, confectionery and many snack foods fall outside the basic-grocery treatment. A cart heavily weighted toward staples can therefore produce a large subtotal but relatively little GST/HST, while a smaller trip containing more taxable snacks may show a more noticeable tax line. Provincial rules can add further complexity. The receipt is therefore doing more than totaling purchases: it is quietly separating categories that Canada’s tax system considers basic groceries from categories treated differently.
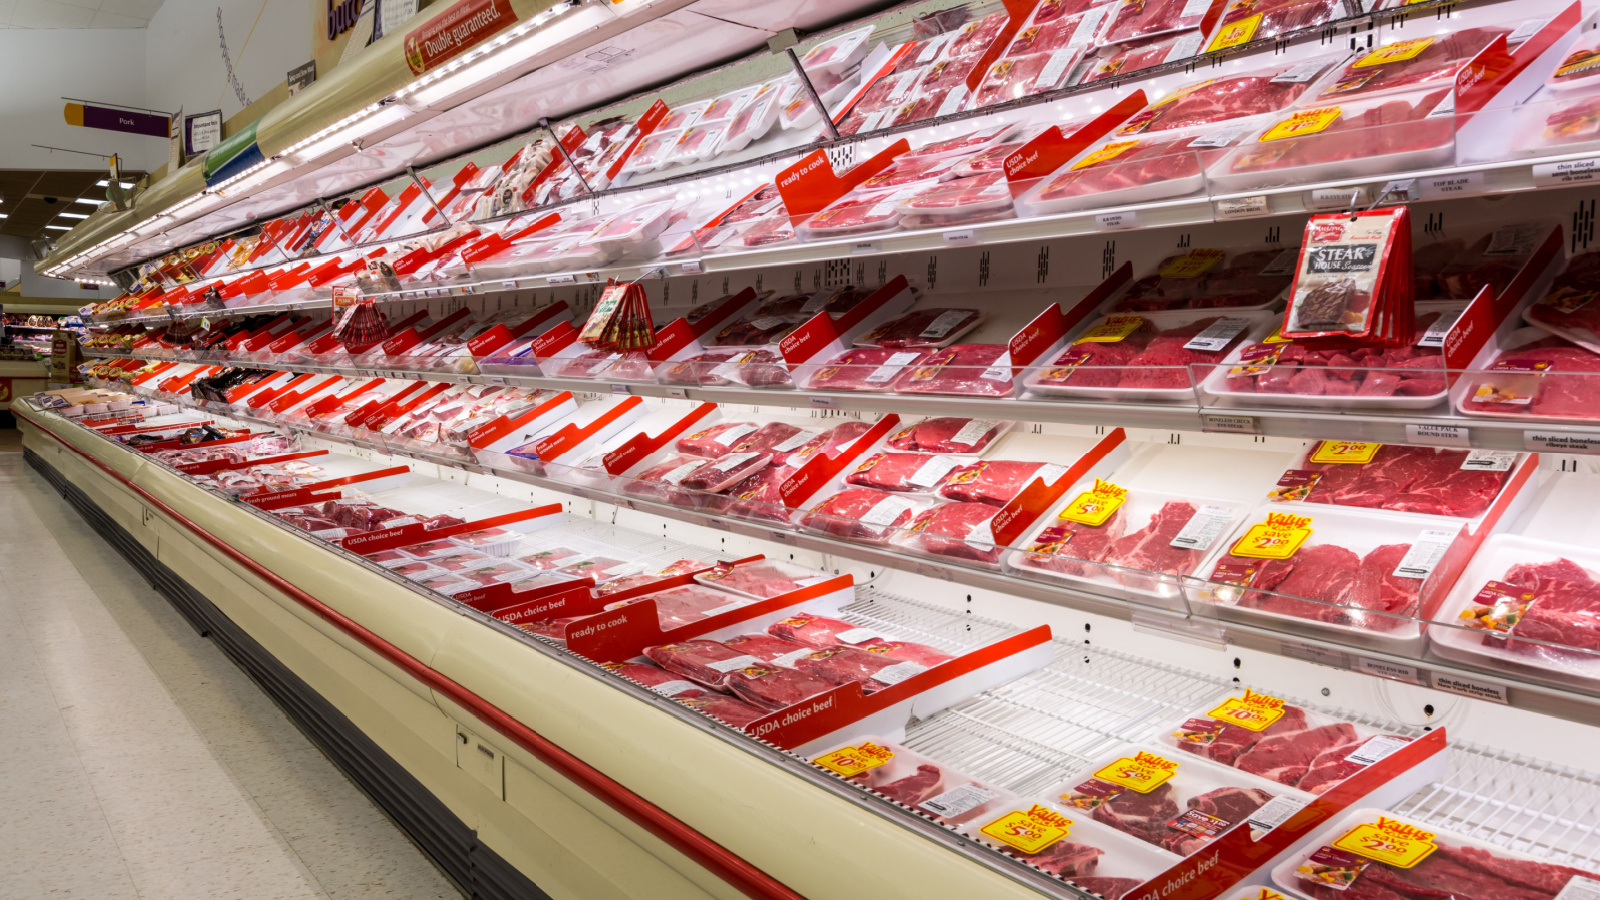
A handful of meat purchases can explain a surprisingly large portion of a grocery bill. Statistics Canada reported that meat prices were 8.5% higher in December 2025 than a year earlier, driven in particular by fresh and frozen beef. By June 2026, meat prices were still running well ahead of many other components of the grocery basket, even as overall food inflation had moderated from earlier peaks.
That pressure becomes obvious on receipts because meat generally appears as fewer, higher-value lines rather than dozens of small purchases. Two packages of beef, chicken for several dinners and a package of processed meat can outweigh an entire section of canned goods or produce. Some households respond by changing cuts, buying less frequently or substituting poultry, beans or other proteins. Those changes matter when comparing receipts over time. A stable grocery total can sometimes hide significant food inflation because the household has quietly reduced the quantity or changed the kind of meat being purchased.
The Price per Kilogram Tells More Than the Sticker Price

Receipts for meat often reveal something shelf signs can obscure: how much is actually being paid for each kilogram. Statistics Canada’s June 2026 national average retail-price data put ground beef at about $16.61 per kilogram and chicken breasts at about $14.63 per kilogram. Individual stores, cuts, promotions and regions vary, but the figures illustrate why relatively small packages can add substantial amounts to the total.
Consider two packages that both cost around $12. One may represent considerably more food than the other because the price per kilogram differs. When shoppers focus only on the package price, those differences are easy to overlook. Receipts that retain weight and unit-price information are particularly revealing because they show whether a larger meat bill came from buying more kilograms or paying more for each kilogram. Over several trips, that distinction becomes useful. It separates genuine consumption changes from price pressure and can reveal when a familiar package has become much more expensive despite looking almost identical in the cart.
Coffee Can Turn a Routine Purchase Into a Noticeable Expense
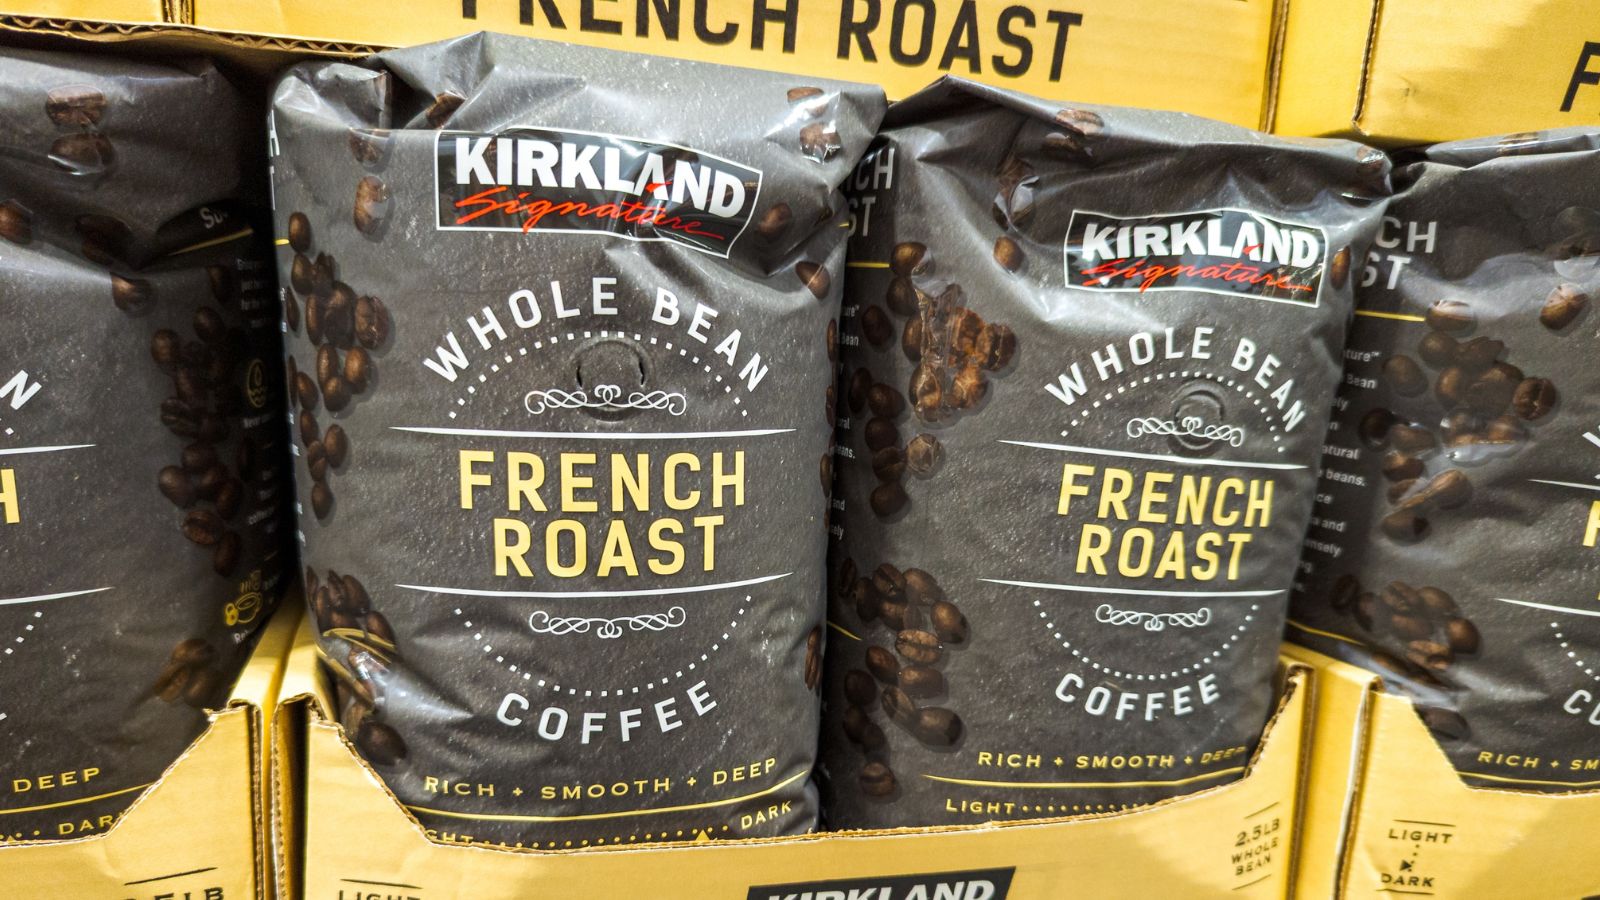
Coffee is a good example of how one familiar product can suddenly become much more important to the receipt. Statistics Canada found that Canadians paid an average of 20.3% more for coffee in 2025 than in 2024. At one point, the increase was even sharper: grocery-store coffee prices in August 2025 were 27.9% higher than a year earlier, with roasted and ground coffee rising particularly strongly.
Global supply conditions played an important role. Statistics Canada linked higher prices partly to unfavourable weather in major coffee-growing regions and higher costs for coffee beans. For a household that buys coffee every week or two, the effect does not appear as a dramatic lifestyle change; it simply looks like another familiar product costing several dollars more. That is precisely why receipts are useful. A recurring coffee line can show how an imported commodity shock gradually works its way into an ordinary Canadian breakfast routine without any change in the number of cups being brewed.
Smaller Packages Can Make the Same Price More Expensive

Not every increase appears as a larger number beside a product. Shrinkflation occurs when a company reduces the quantity in a package while keeping the price unchanged or changing it by less than the reduction in quantity. Statistics Canada specifically tracks quantity and quality changes when measuring inflation because comparing prices alone can miss what consumers are actually receiving for their money.
A receipt may therefore show the same $4.99 cereal, crackers or frozen food that appeared months earlier while the package in the cupboard contains fewer grams. Unless the receipt includes quantity information, the change may be almost invisible once the packaging has been discarded. This is where an old receipt paired with an old photograph, shopping app history or unit-price record becomes more revealing than the checkout total alone. Households can spend the same amount yet bring home less food. That means a flat receipt total does not always represent stable purchasing power, particularly in packaged categories where manufacturers can alter sizes without dramatically changing the product’s appearance.
Produce Prices Can Swing Much Faster Than the Overall Grocery Bill
Fresh produce can make two otherwise similar grocery trips look remarkably different. In March 2026, Statistics Canada reported that fresh vegetable prices were 7.8% higher than a year earlier, up sharply from a 0.5% increase in February. Cucumbers, peppers and celery recorded notable increases, with tighter supplies linked partly to adverse growing conditions in producing countries.
Those movements illustrate why produce lines deserve to be examined separately rather than treated as one predictable category. A family may purchase roughly the same volume of vegetables but end up with a considerably larger produce subtotal simply because several frequently purchased items are temporarily expensive. The opposite can happen when seasonal supply improves. Receipts preserve those swings in a way household memory rarely does. After several months, shoppers may remember that groceries “felt expensive” without remembering that peppers or cucumbers were unusually costly for only part of that period. Itemized receipts reveal when the pressure came from a temporary produce shock rather than a permanent expansion of the family’s shopping list.
The Produce Total Depends Heavily on Which Fruits and Vegetables Fill the Cart
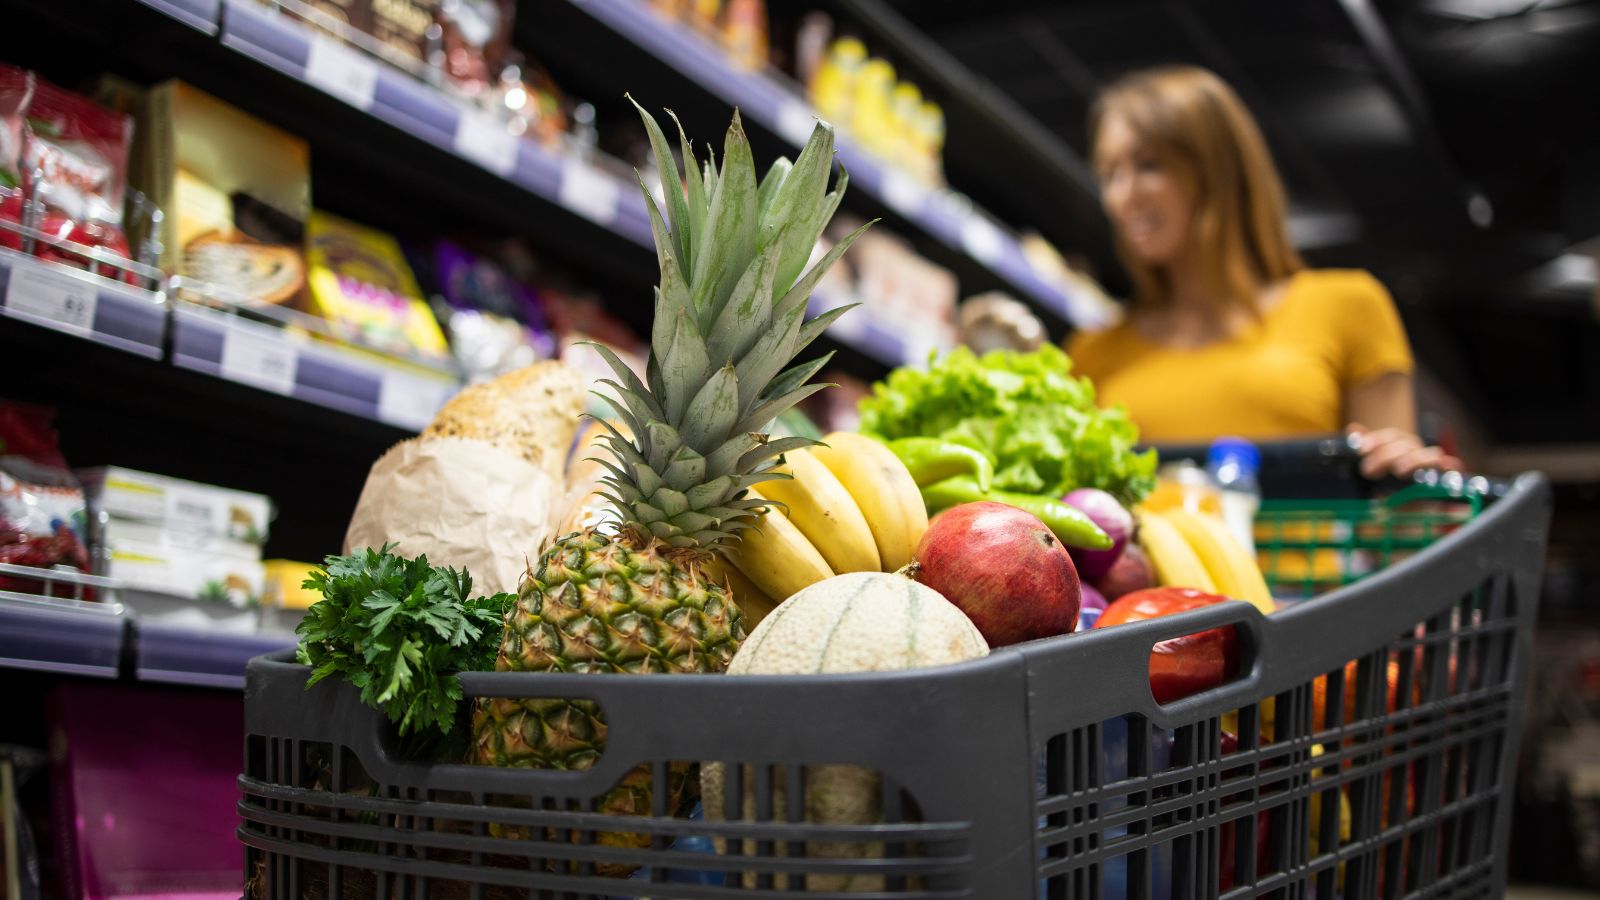
Even within the produce department, dollars do not stretch equally. Statistics Canada’s June 2026 national averages showed apples at roughly $6.33 per kilogram, bananas at $1.87, tomatoes at $5.03 and potatoes at $5.18. Those figures are not direct comparisons of nutritional value or quality, but they demonstrate how dramatically the final produce bill can change depending on the mix chosen.
Imagine two households each carrying home several kilograms of fruits and vegetables. One basket built around bananas and lower-cost seasonal items could generate a much smaller total than another containing berries, apples, specialty vegetables and higher-priced tomatoes. Nothing about the number of bags would necessarily reveal that difference. The receipt does. This is one reason grocery spending can change even when households feel they are buying “the same amount of produce.” Variety, seasonality and substitutions matter. Statistics Canada also cautions that average prices can change because of product rotation, quality and shifting consumer preferences, making the exact item mix crucial when comparing receipts.
Milk, Butter and Eggs Create a Large Staple Base Before the Extras Begin
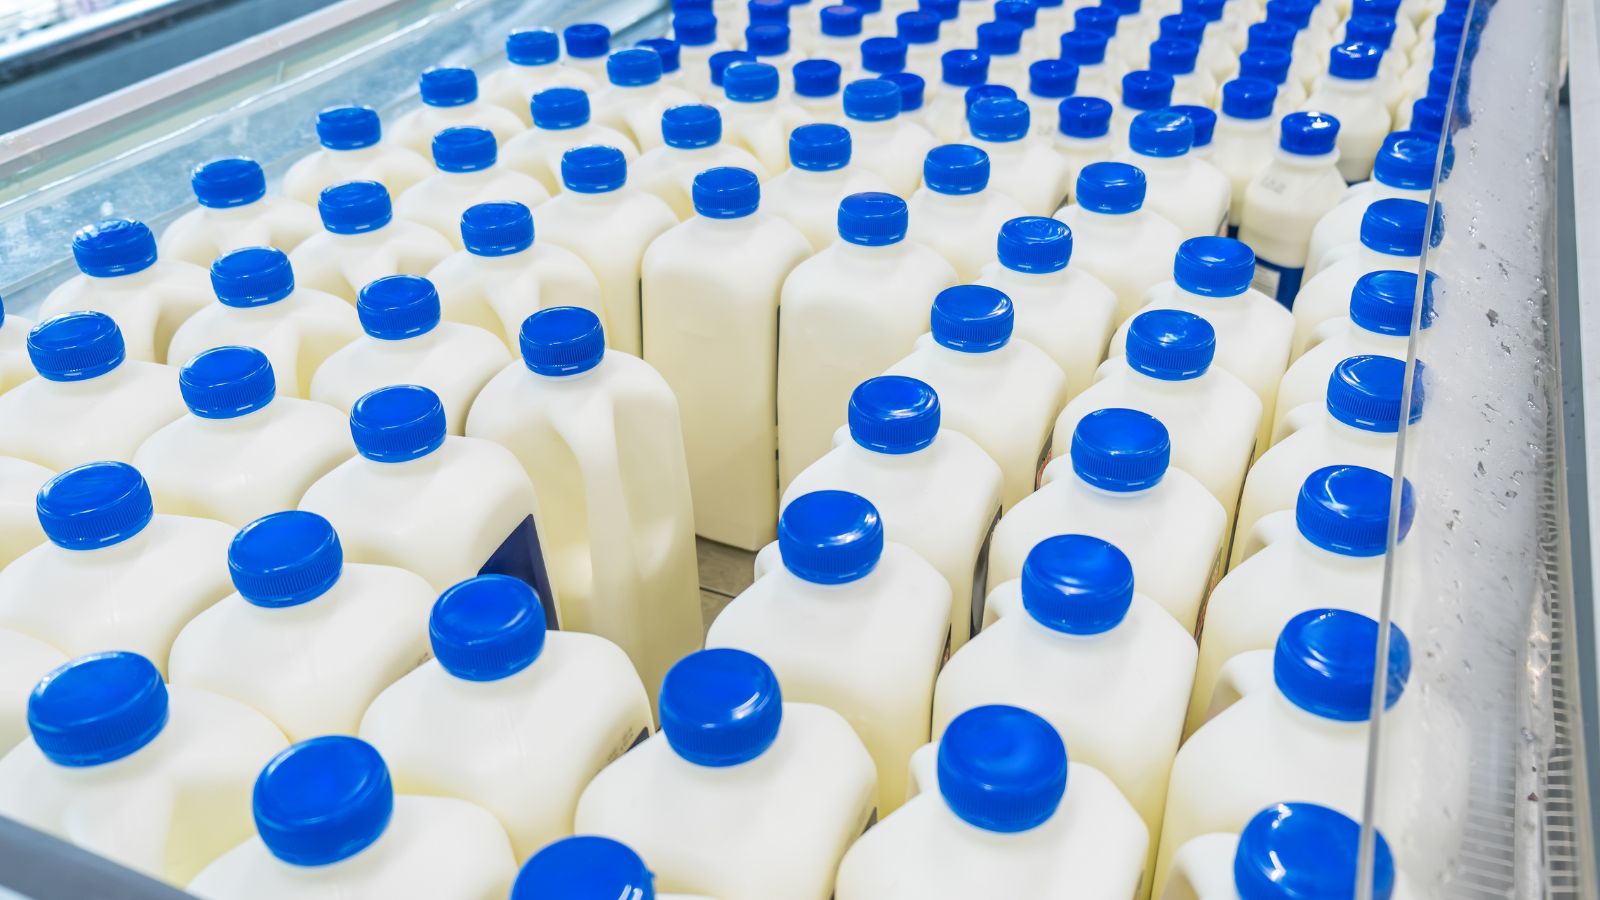
Staples can quietly build a substantial grocery subtotal before a shopper reaches meat, produce or snacks. In June 2026, Statistics Canada’s national average prices included about $5.50 for two litres of milk, $5.94 for 454 grams of butter and $4.88 for a dozen eggs. Together, those three ordinary purchases already represent more than $16 before cheese, yogurt, bread or anything intended for dinner enters the basket.
The significance becomes clearer for families purchasing these products frequently. A dollar increase on an occasional specialty item may matter less over a year than smaller repeated increases on milk, eggs and other basics. Receipts help expose that repetition. Instead of concentrating only on unusually expensive purchases, a household can identify items appearing almost every week and calculate how much of the monthly grocery budget they absorb. The result can be counterintuitive: there may be no single shocking purchase, just a collection of modestly priced essentials whose frequency turns them into some of the most important lines on the household food budget.
Bread and Rice Show How Purchase Frequency Changes the Monthly Picture

Some grocery items are cheap enough individually to attract little attention but important enough to recur constantly. Statistics Canada’s June 2026 averages put a 675-gram loaf of white bread at about $3.61 and two kilograms of white rice at about $9.46. Their influence on a household budget depends not only on price but also on how often each product needs to be replenished.
Bread may appear on several receipts in a month, while a large bag of rice might appear only once. Looking at a single shopping trip can therefore give a distorted impression of where the food budget is going. A more revealing approach is to group receipts across four or five weeks. Frequent $3-to-$5 purchases begin to accumulate, while occasional larger pantry purchases become easier to place in context. This matters for families trying to understand why a “normal” weekly shop keeps changing. The answer may lie less in extraordinary purchases than in the combined cost and frequency of everyday staples.
Packaging and Supply-Chain Costs Are Hidden Behind the Shelf Price
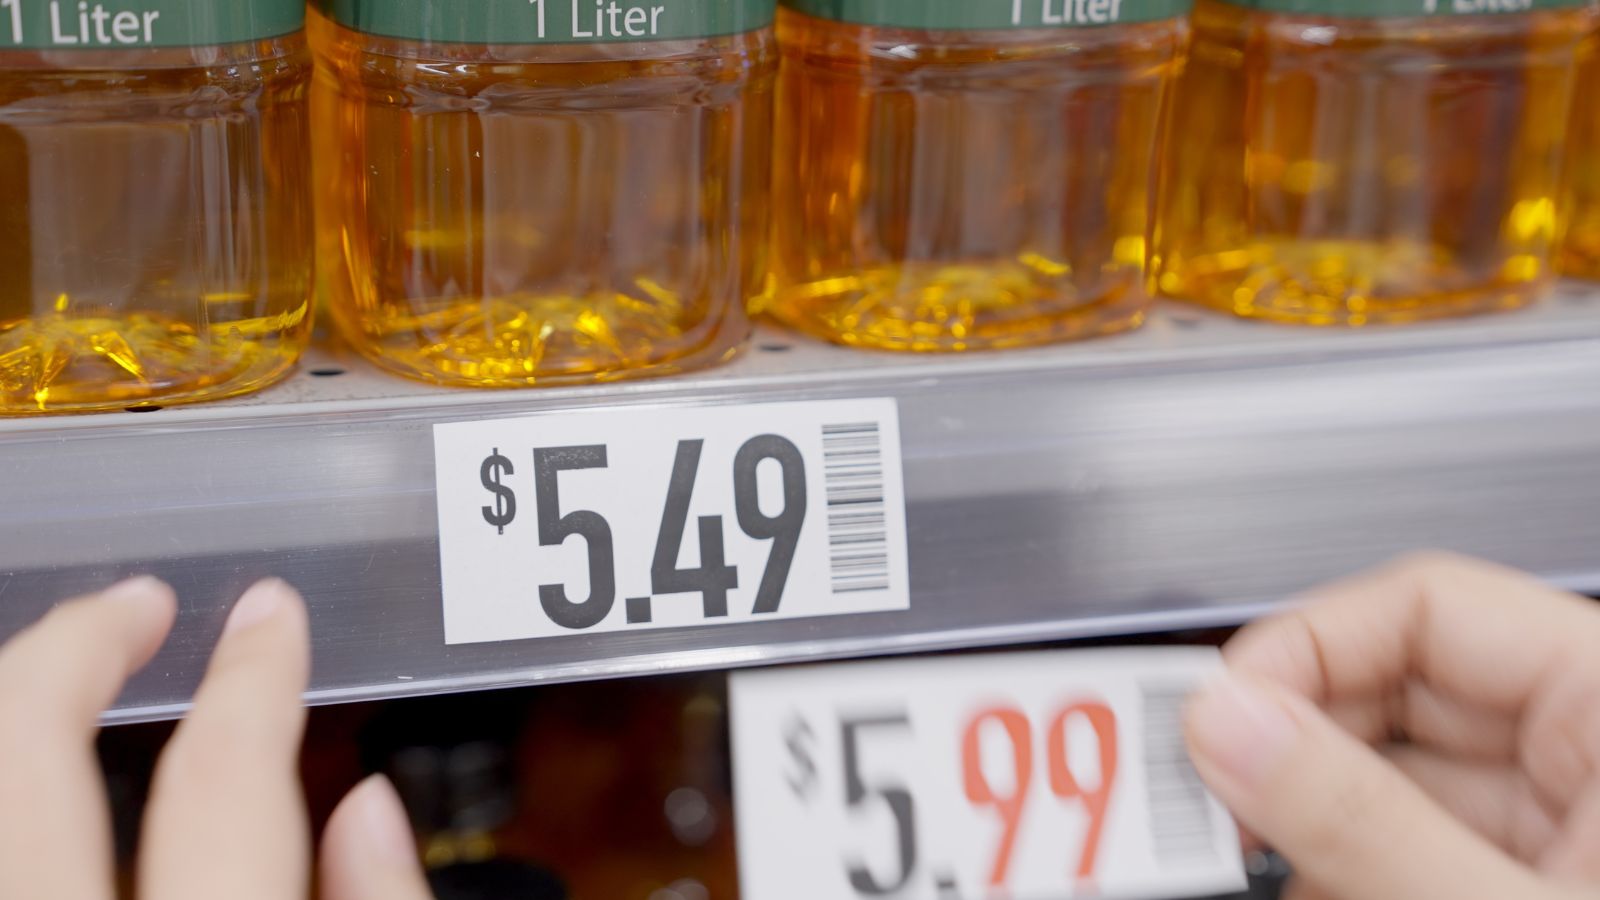
The number printed beside a grocery item is the endpoint of a much longer chain of costs. Statistics Canada’s Food Price Data Hub shows how different parts of that chain can move in opposite directions. In June 2026, prices for plastic bottles at the manufacturing level were 12.6% higher than a year earlier, while paperboard containers were 5.8% lower. Prices for animals and animal products purchased by manufacturers were up 7.9%, while crop-product input prices were lower.
That does not mean a 12.6% rise in bottle costs automatically creates a matching increase in beverages. Retail prices incorporate ingredients, manufacturing, packaging, transportation, wholesaling, retail services and competitive decisions. Still, receipts reflect the final result of those pressures. The same data hub also tracks wholesale and grocery-store retail-service markups, underscoring that several layers stand between farms and checkout counters. A receipt cannot identify which layer caused each price movement, but it can reveal which products are absorbing the combined effect most visibly.
Prepared Food Can Cost More Than Ingredients—and Change the Tax Treatment
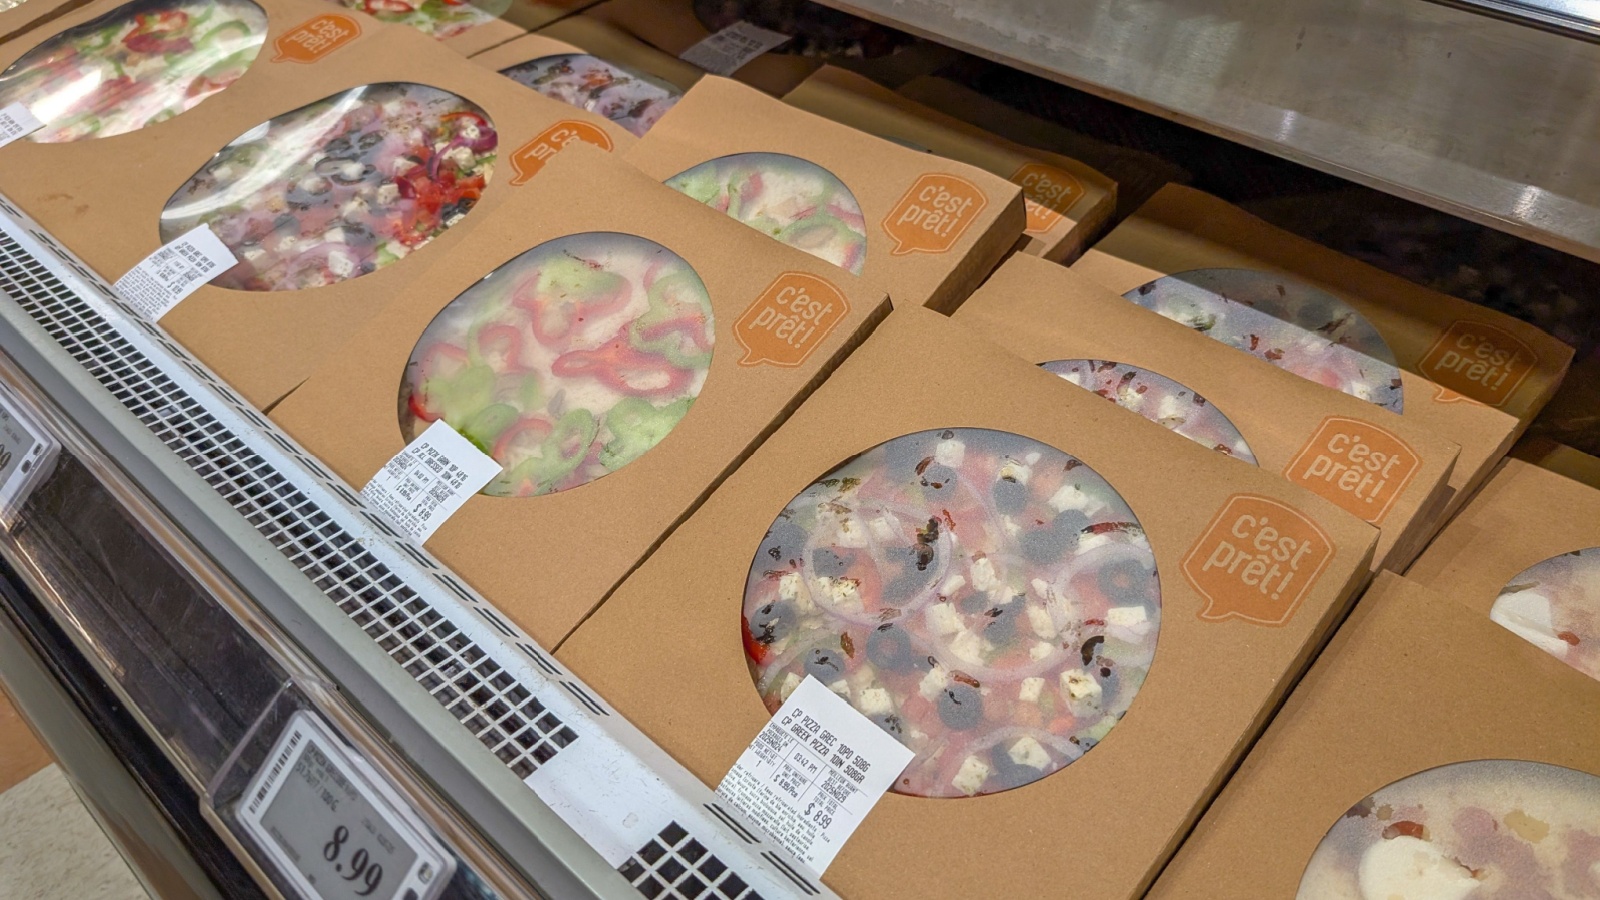
Convenience has a financial signature on Canadian grocery receipts. CRA rules distinguish many ready-to-eat foods from basic grocery ingredients. Food kept hot for consumption is generally taxable. Non-frozen sandwiches and similar ready-to-eat products are taxable, as are many prepared salads and platters. By contrast, numerous basic ingredients remain zero-rated, and even seemingly similar products can receive different treatment depending on how they are packaged or sold.
That difference can turn the receipt into a record of how much a household is paying for saved time. A loaf of bread, sliced meat and vegetables may receive different tax treatment from a ready-made sandwich assembled from similar ingredients. A salad kit requiring mixing is treated differently under CRA guidance from certain ready-to-eat salads. Convenience can still be entirely rational for a household balancing work, school and caregiving, but its cost is easier to see when prepared-food lines are grouped together. Receipts can reveal that rising grocery spending is partly purchasing preparation and convenience, not simply larger quantities of food.
The Store Name at the Top of the Receipt Can Be Part of the Savings Strategy

Where Canadians shop can change as significantly as what they buy. Statistics Canada documented a notable shift during the earlier period of intense food inflation. The share of retail food sales occurring at traditional food and beverage stores fell to about 70% in late 2022, while the share at general merchandise stores—including warehouse clubs and supercentres—rose to 25.9%, from 21.6% in early 2021.
The figures describe an earlier inflationary episode rather than today’s exact shopping pattern, but they show why the merchant name on a receipt matters. Consumers can respond to higher prices by moving portions of their grocery list to discount formats, warehouse stores or retailers that sell groceries alongside other merchandise. A pile of receipts from several chains may therefore represent deliberate cost control rather than disorganized shopping. Comparing the same recurring products across those receipts can show whether the extra trip actually produced savings. The location of the purchase becomes another line in the household’s inflation response.
Substitutions Can Hide How Much Prices Have Changed
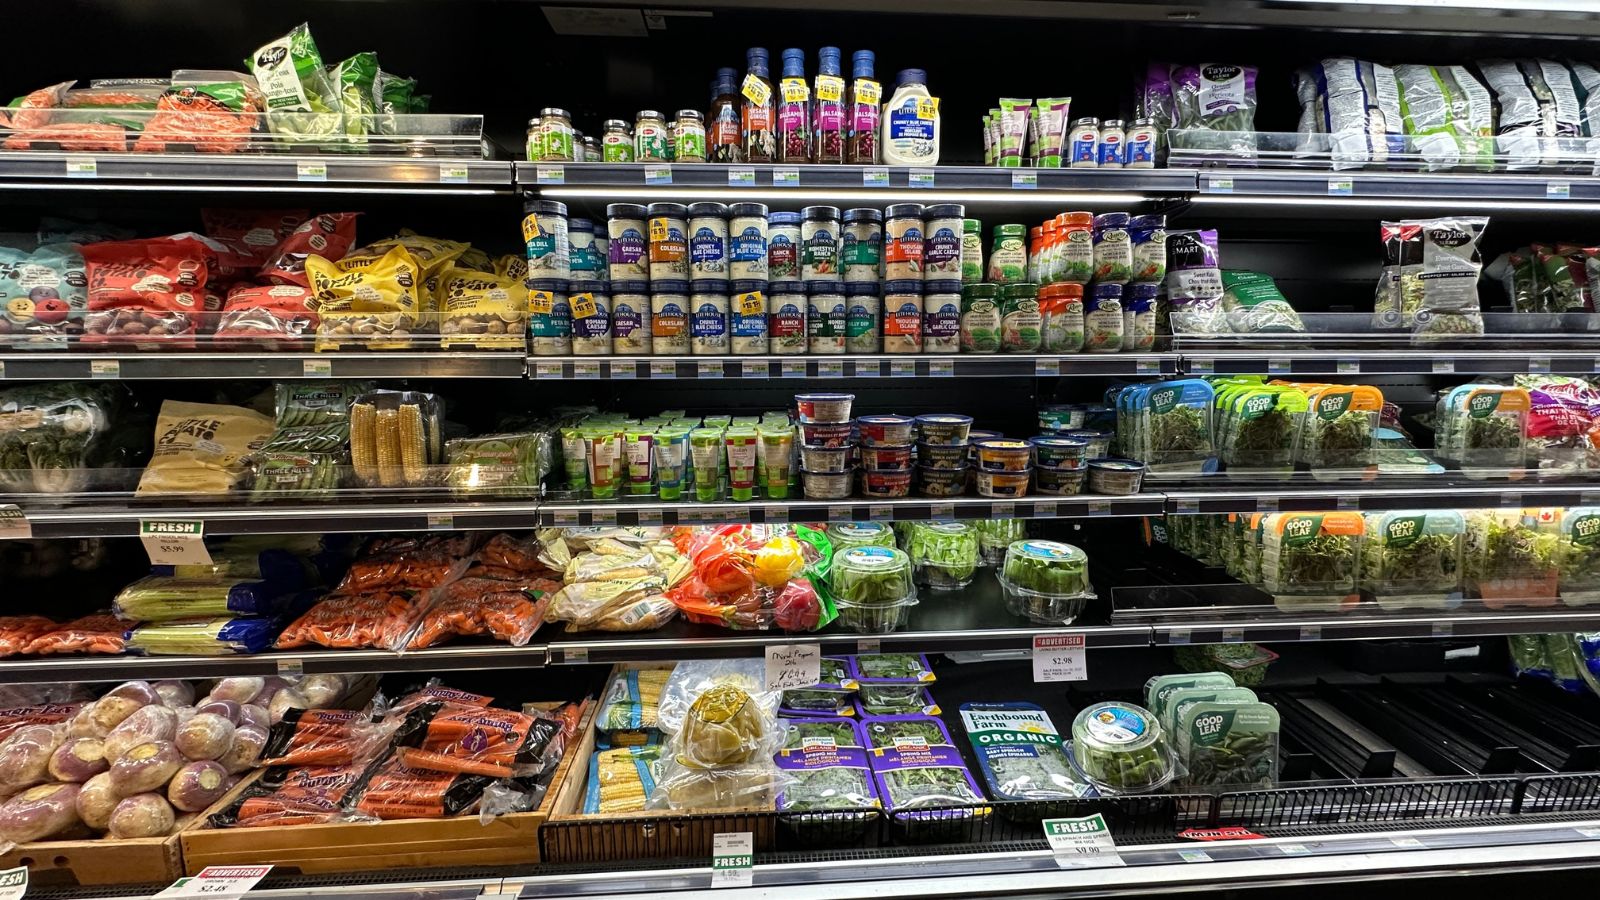
A household can hold its grocery bill steady by changing what goes into the cart. During the inflation surge examined by Statistics Canada, about half of surveyed Canadians reported seeking sales or promotions, while a similar share said they had bought cheaper alternatives, brands or items in response to price pressure. Statistics Canada also observed consumers buying less food in volume even while spending more dollars at food and beverage stores.
That behaviour creates an important receipt illusion. Suppose a family’s weekly total remains around $180, but premium brands disappear, beef is purchased less often and sale-priced alternatives replace familiar products. The bill may look stable even though maintaining the old shopping pattern would have cost considerably more. Comparing receipts by total alone misses the adjustment. Product descriptions, package sizes and brands reveal it. In that sense, receipts document not only inflation but adaptation. They can show the point where households stopped absorbing higher prices and began actively redesigning the basket to protect the total.
Promotions and Loyalty Discounts Can Separate Shelf Price From Actual Price

The price printed on the shelf is increasingly only part of the story. Canada’s Competition Bureau has noted that grocery loyalty programs can reduce costs through special offers or points that are later redeemed for groceries. Promotional flyers, digital offers and member pricing can create multiple effective prices for the same product depending on when it is purchased and whether the shopper participates in the relevant program.
Receipts are therefore valuable because they record the amount actually paid rather than the price shoppers remember seeing. A product listed at $6.99 may appear with a promotional deduction, loyalty discount or points redemption that reduces the real cost. Conversely, forgetting to load an offer or use a membership account can leave the full price on the receipt. Over time, the discount lines can reveal how dependent a grocery budget has become on promotions. A household that regularly saves $10 or $15 per trip through offers is effectively operating with a different grocery price structure from someone purchasing the same products without those discounts.
Multi-Buy Deals Can Make “Savings” Harder to Judge

Deals such as “3 for $10” can encourage shoppers to focus on the bundle rather than the individual cost. Québec strengthened food-price display rules in 2025 so that when products offered as a multi-buy can also be purchased individually, the per-item price must be displayed alongside the bundle price. The province also requires consistent units of measurement for comparable foods in stores covered by its unit-pricing requirements.
The principle is useful well beyond Québec: quantity and unit cost matter more than the size of the promotional sign. A receipt can show whether a multi-buy deal saved money or simply increased the number of items purchased. Three packages at a modest discount still cost more than one package if only one was needed. Conversely, stocking up on a heavily used non-perishable item can reduce future spending. Looking back at receipts helps distinguish those outcomes. Promotional savings should ideally be evaluated against consumption, not merely against the advertised regular price. Otherwise, the receipt may reveal that the “deal” increased total spending.
Shampoo, Detergent and Paper Goods Can Inflate What Feels Like a Food Bill
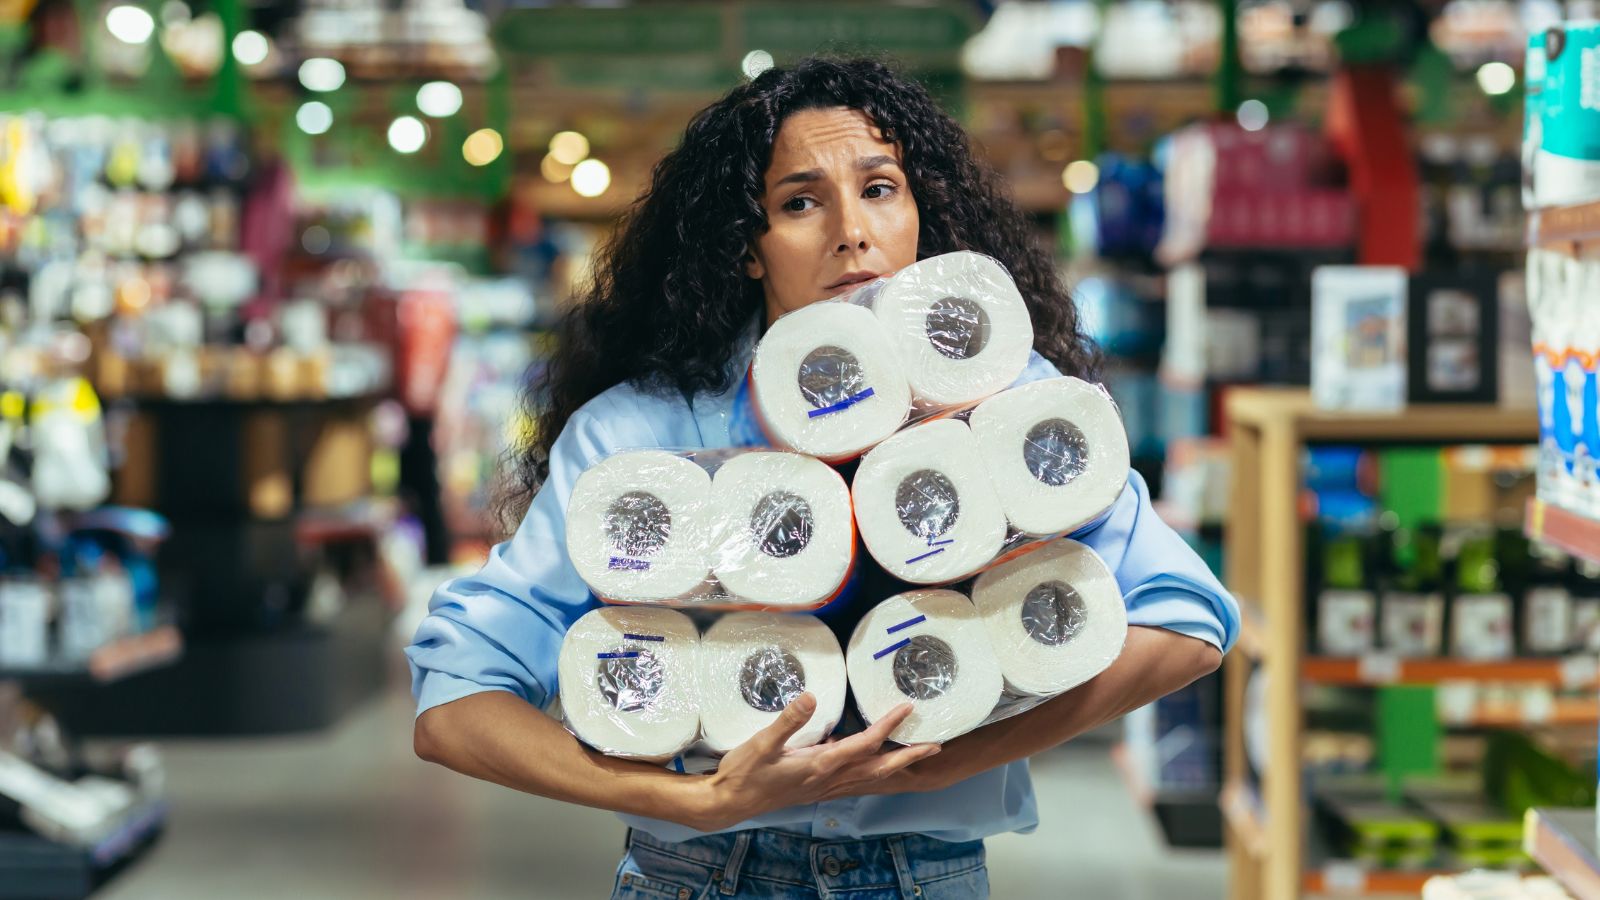
Many Canadians use the word “groceries” to describe everything purchased at a supermarket, but not every line on a supermarket receipt is food. Cleaning supplies, paper products, toiletries and personal-care items can add significant amounts to the checkout total, particularly when several need replacing in the same week. Statistics Canada has long used retail transaction data that cover food as well as selected household and personal-care products, illustrating how closely those purchases can overlap at retail.
This distinction matters when families try to estimate how much food actually costs them. A $240 supermarket receipt containing laundry detergent, shampoo, garbage bags and paper towels is not comparable with a $200 receipt containing food alone. Separating non-food items can produce a clearer picture of the household food budget and explain occasional spikes that otherwise look like grocery inflation. The receipt is particularly useful because memory tends to compress the whole transaction into one number. Itemization restores the difference between feeding the household and maintaining it.
Long-term spending data provide useful context for what appears on individual receipts. Statistics Canada’s Survey of Household Spending found that the average Canadian household spent $8,659 on food purchased from stores in 2023, 7.4% more than in 2021. Meat accounted for an average of $1,544, while dairy products and eggs accounted for $1,203. Non-alcoholic beverages and the broad “other food products” category reached $2,153.
Those numbers are national averages from 2023, not targets for a particular household, but they demonstrate how dramatically food spending is distributed across categories. A family that rarely buys meat may have a very different budget profile from one purchasing it several times each week. Likewise, households buying substantial beverages, snacks or prepared foods can see those smaller-looking lines accumulate into a major annual category. Sorting several months of receipts into broad groups can therefore be more informative than comparing weekly totals. It shows which food habits are actually consuming the largest share of available grocery money.
The Same Receipt Would Not Cost the Same Everywhere in Canada
National average food prices are useful benchmarks, but Canadian grocery costs vary geographically. Statistics Canada publishes average retail prices by province and explicitly cautions against treating provincial figures as perfectly comparable because the brands, package sizes and quality mix available in different regions can differ. Store formats, transportation requirements, local competition and product availability also shape what consumers encounter.
That makes the postal code behind a receipt important context. A $150 basket in one province cannot automatically be labelled cheaper or more expensive than a $165 basket elsewhere without checking whether the products and quantities match. Even comparing receipts from two relatives can be misleading if one shops at a warehouse club and the other at a small conventional supermarket. Geographic differences are especially relevant when people encounter national headlines about the “average” price of milk, meat or produce. Those numbers describe a broad market. The receipt records the actual local market a household faced on a particular day.
A Stack of Receipts Can Become a Personal Inflation Tracker
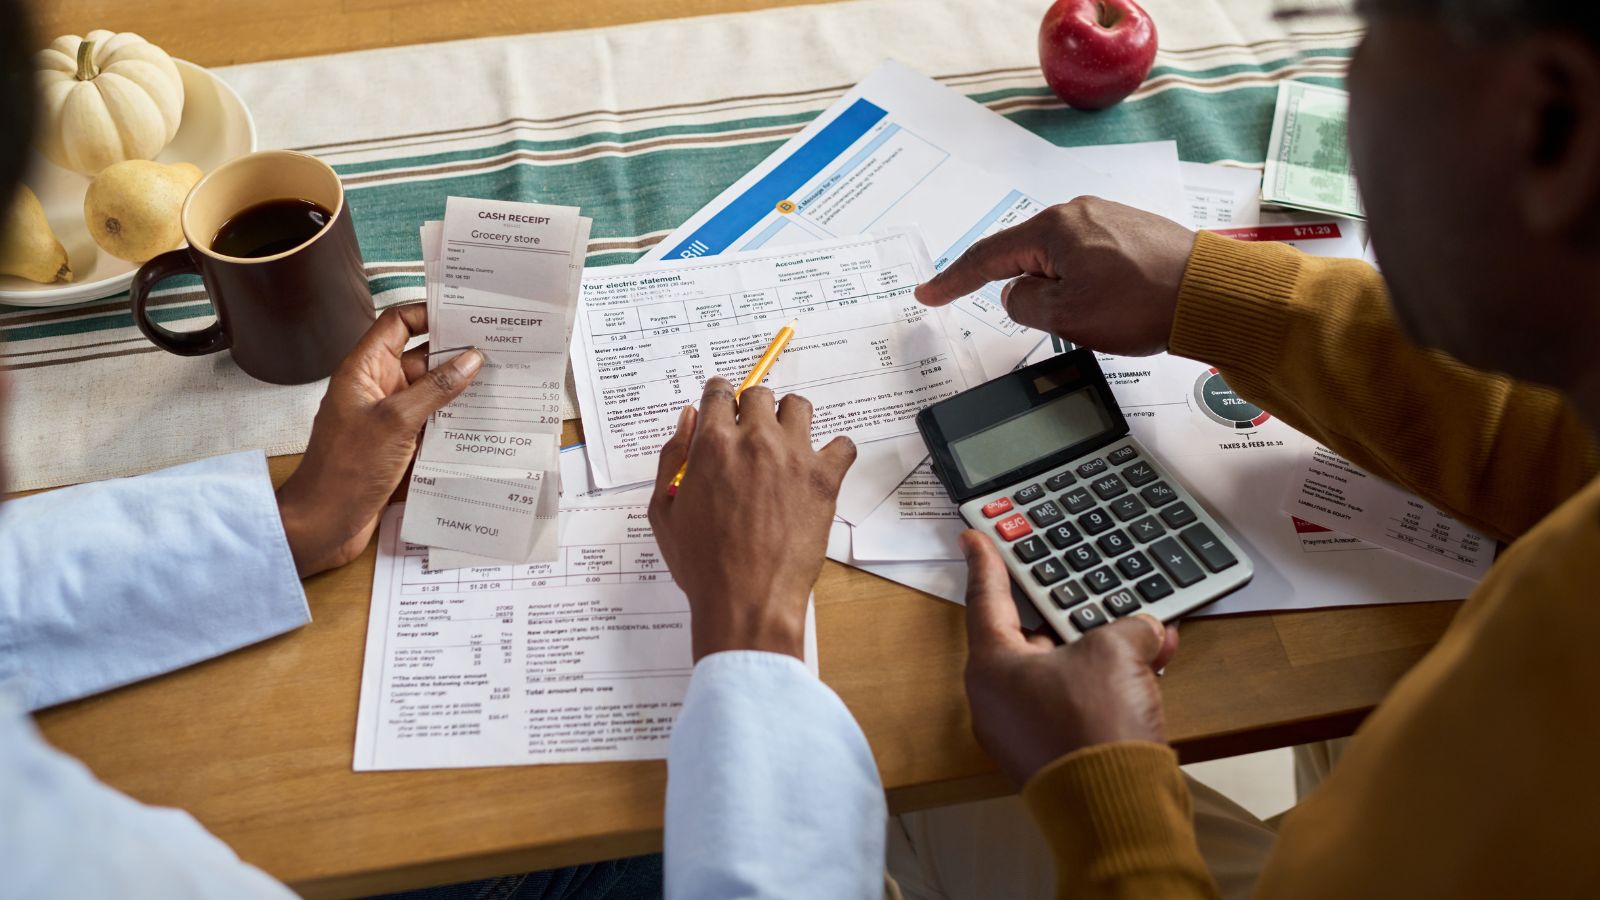
The most revealing receipt is often not the newest one but the one that can be compared with an older version of the same shopping routine. Statistics Canada’s Personal Inflation Calculator exists for a similar reason: the official CPI represents price change for the average Canadian household, while individual households experience inflation differently because their spending patterns differ.
Receipts provide the raw material for that personal story. A household that buys large amounts of meat and coffee may experience stronger grocery pressure during a period when those categories rise quickly. Another household spending more on rice, legumes and sale-priced produce may experience something different. Recording recurring items, quantities and actual prices once a month can reveal whether spending is rising because prices increased, packages became smaller, more convenience foods entered the basket or shopping habits changed. The total at the bottom matters, but the lines above it explain why. Over time, those little paper records can become one of the clearest accounts of where household food money actually went.
16 Costco Canada Habits That Could Be Costing Shoppers More Than They Save
The Executive Membership can feel like an obvious upgrade because the 2% annual reward sounds straightforward. For households that spend heavily at Costco Canada, the extra fee may be easy to justify. But the habit becomes costly when shoppers upgrade first and calculate later. A Gold Star Membership costs less, while Executive costs more and only pays off if eligible annual spending is high enough to offset the difference.
16 Costco Canada Habits That Could Be Costing Shoppers More Than They Save
This Options Discord Chat is The Real Deal
While the internet is scoured with trading chat rooms, many of which even charge upwards of thousands of dollars to join, this smaller options trading discord chatroom is the real deal and actually providing valuable trade setups, education, and community without the noise and spam of the larger more expensive rooms. With a incredibly low-cost monthly fee, Options Trading Club (click here to see their reviews) requires an application to join ensuring that every member is dedicated and serious about taking their trading to the next level. If you are looking for a change in your trading strategies, then click here to apply for a membership.